|
<< Click to Display Table of Contents >> File |
  
|
|
<< Click to Display Table of Contents >> File |
  
|
•File
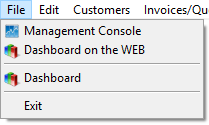
- Management Console
The Management Console displays a range of business activity related data (predominantly Sales) for the specified date range. The current day’s data is displayed by default.
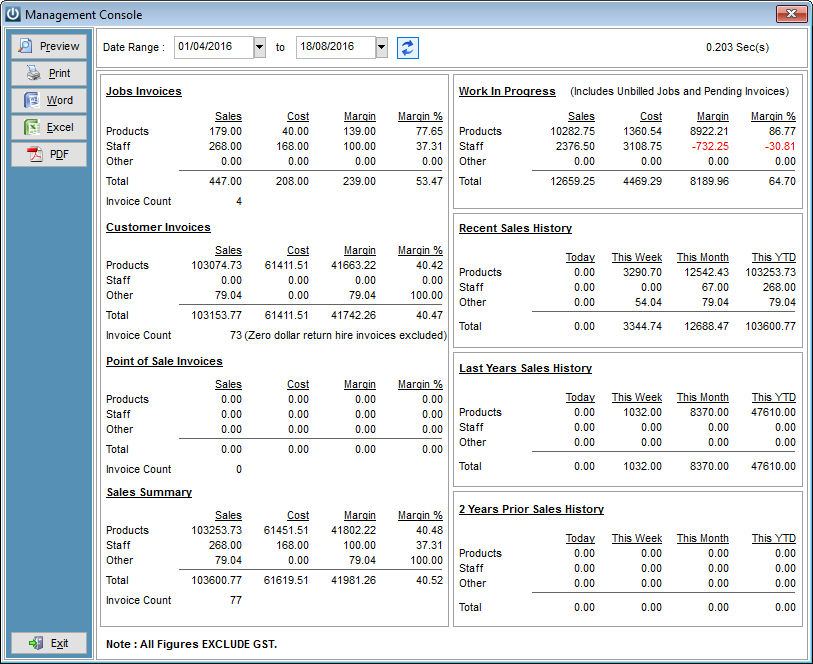
It allows a quick and easy gauge to be kept on how key business indicators are tracking over the specified date range. If a new date range is chosen select the Refresh Data button to refresh the data displayed. Data can be exported / printed into various formats.
- Dashboard on the WEB
This option will provide you with access to a range of standard graphs, login to the demonstration site with the demo email and password.
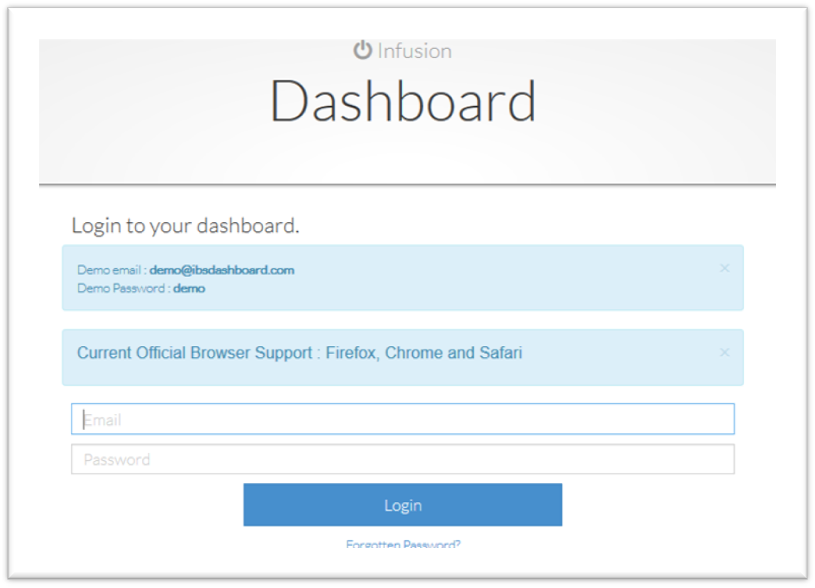
Once activated your company data can be displayed and view via the website.
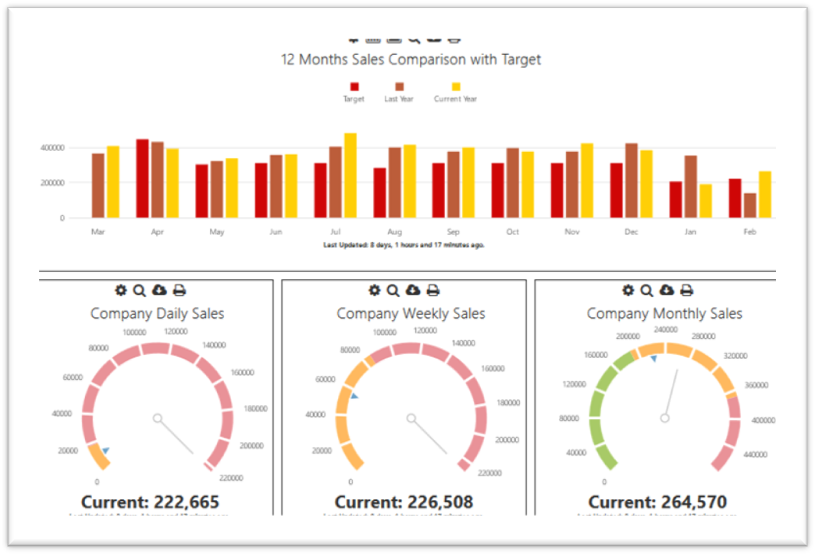
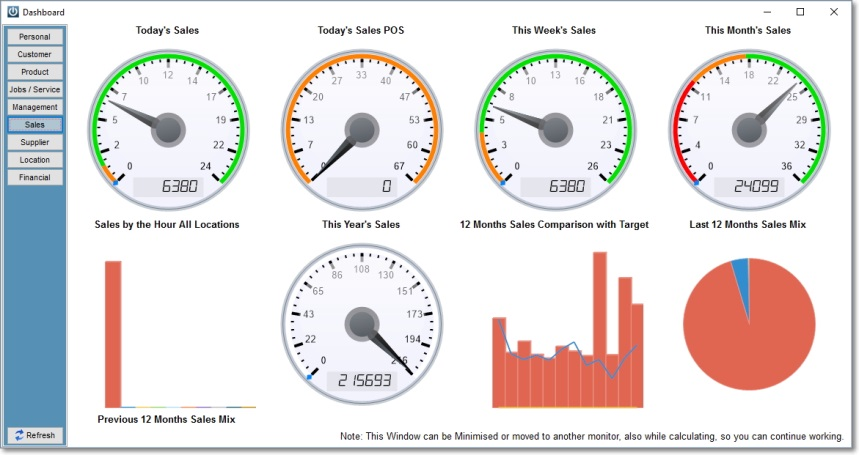
- Dashboard
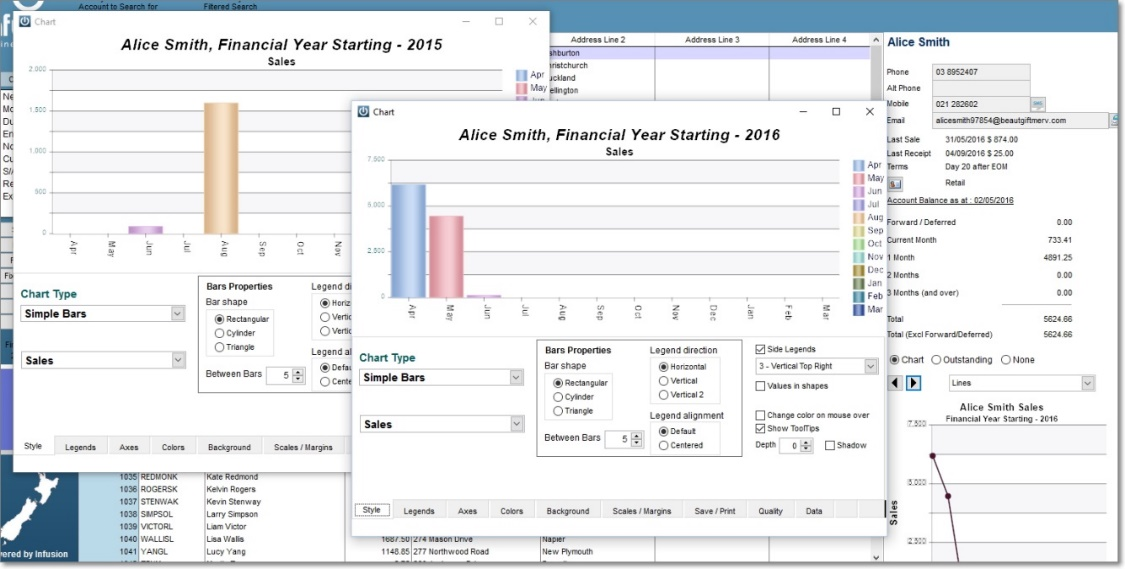
To make this option visible, first the user ID has to be allowed access to the charts. This is done from Staff / Manage Staff. Open the staff record and select the allowed chart options in the Charts tab. You can also select 'Allow advanced Options on Chart display' if required, which will allow the user to alter the display format of the chart - these alterations can be saved per user. The user will need to log off and log back on to activate the 'Dashboard' via the 'File Menu'.
There are more than 30 Charts and Gauges available on the Dashboard. To find more information on this please see the Infusion Dashboard Charts Knowledgebase Article.
- Exit
Exits the user out of Infusion software.
The last user to exit out of Infusion will be asked to create a backup. Selecting the Yes option to start the process. Select the Default Location option to set a default directory for backups to be saved to. Select the Backup Images option to include the files in the Images folder in to the backup. Select Backup. Browse to the required location if this is different from the default location. Select Save. Select Yes to testing the backup file.